Data-Driven SEO: Strategy, Data Sources, and Methodology
Data-driven SEO means that every measure on your website rests on a measurable cause, has a goal set in advance, and is then checked against real data. No guesses, no standard checklists. The basis is above all data that Google itself provides, meaning Search Console, crawl and rendering data, server logs, and your company's revenue data. Anyone who works this way recognizes a ranking loss as a pattern in the data instead of just seeing a decline in a tool, and can cleanly distinguish whether a technical error, an algorithmic reassessment, or a manual action is behind it. This article shows which data sources a reliable SEO strategy is built from, in which steps it is set up, and where data is often misread.
SEO strategies based on reliable data
SEYBOLD ONE combines data-driven strategies with technical SEO and brand strategies to improve search engine and AI visibility with purpose.
Get a free consultationWhat sets data-driven SEO apart from routine SEO
In many companies, SEO follows a fixed rhythm: a few texts a month, an occasional tool report, now and then a few backlinks. The problem is not the effort but the missing link between measure and effect. Nobody can later say which measure had which effect, and when visibility suddenly collapses, the data basis for a diagnosis is missing.
Data-driven SEO reverses this logic. It starts with a hypothesis derived from data, for example: “The category pages have been losing impressions since the relaunch because internal links point to redirected URLs.” From this follows a clearly defined measure, a measurement period, and a criterion by which success or failure is read. Three features characterize this approach:
- Cause before measure: You only optimize once the cause of a problem or potential is proven.
- Primary data before estimates: Data from Search Console, crawls, and server logs takes precedence over modeled visibility values from third-party tools.
- Business relevance: What is measured is not just whether rankings rise but whether inquiries, orders, and revenue follow.
That fits how Google describes its own systems. According to Google, 15% of the searches entered every day are completely new, which is why automated systems assess relevance and reliability. Anyone who aligns their strategy with rigid keyword lists overlooks exactly this moving part of demand, which only your own search query data makes visible.
The data sources that matter
A data-driven SEO strategy is only as good as its data basis. In practice, we work with five sources that complement and check each other. None of them is enough on its own.
| Data source | What it shows | Where its limit lies |
|---|---|---|
| Google Search Console | Clicks, impressions, CTR, position per query and URL; indexing status; manual actions; security issues | Time-limited retention in the interface, row limits on exports, anonymized queries |
| Crawl data | Status codes, redirect chains, canonicals, internal linking, click depth, duplicates | Shows the technical structure, not the actual behavior of Googlebot |
| Server logs | Which URLs Googlebot actually fetches, at what crawl frequency, with which response codes | Require access, processing, and matching against verified bot IP ranges |
| Web analytics and CRM | Behavior of organic visitors, conversions, revenue, lead quality | Consent rates and tracking gaps distort the values |
| Link profile data | Referring domains, anchor texts, growth patterns, conspicuous spam waves | No tool captures the web completely; ratings are models, not Google signals |
Two points deserve special attention. First, Search Console is the only source in which Google itself provides information. The overview of Search Console reports names, among others, the reports on manual actions and security issues; they are the verifiable basis for telling a direct penalty from an algorithmic fluctuation. Second, it is worth securing this data permanently. In February 2023, Google introduced the bulk data export from Search Console to BigQuery, which lets you transfer performance data continuously into your own data warehouse. This creates time series over years that enable the decisive comparison for seasonal patterns or after a core update.
From measurement to strategy: the process in six steps
Data sources only become a strategy when they are brought together in a fixed methodology. The following sequence has proven itself in projects with shops, mid-sized companies, and startups, even though scope and depth vary with the starting point.
- Set the baseline. Before anything is changed, document the current state: clicks and impressions per page type, indexed URLs, crawl behavior, organic revenue. Without a baseline, no effect can be proven later.
- Segment the data. Totals hide problems. Segment by page type (category, product, guide, location), by device, by branded and generic queries, and by directories. A stable total can mask a massive loss in a single segment.
- Identify anomalies and patterns. You are looking for breaks in the time series, such as an abrupt drop on a specific date, a creeping decline over weeks, or a rise in non-indexed URLs. The date of a break is often the most important clue: it can be compared with deployments, relaunches, core updates, or changes in the link profile.
- Form and test cause hypotheses. Every anomaly is translated into a testable hypothesis and checked against a second data source. If a directory loses impressions, the logs show whether Googlebot crawls it less often, and the crawl shows whether status codes or canonicals have changed.
- Prioritize measures. Prioritization follows expected effect, effort, and risk. A faulty robots.txt rule that blocks a high-revenue directory takes precedence over any new content.
- Implement, measure, document. Every measure gets a date, a goal, and a measurement period. This creates a change log that considerably shortens the diagnosis for future fluctuations.
The value of this process lies less in individual analyses than in repetition. With every cycle the data basis grows, and decisions become faster and safer.
Three typical use cases
The difference between data-driven and routine SEO shows most clearly where damage limitation is involved. We encounter the following three situations most often in consulting.
Sudden ranking loss
When visibility collapses, the first question is not “What do we optimize?” but “What has changed?”. The comparison begins in Search Console: does the decline affect all page types or only individual ones? Do impressions, meaning delivery, fall, or only the click-through rate, for example because the appearance of the search results has changed? Does the break coincide with a known update or with your own deployment? Only when these questions are answered can you decide whether technical corrections, content revision, or a cleanup of the link profile is the right lever. How we proceed is described on our page on improving Google rankings and regaining visibility.

Suspected Google penalty
Google uses automated spam detection on a large scale. By its own account, these systems identify around 40 billion spam pages every day; in addition, specialized teams check manually when guidelines are violated. On the same page, Google names more than 180 million messages sent to website owners about spam incidents in 2018 alone. For you this means: a manual action is documented in Search Console, an algorithmic devaluation is not. A data-driven analysis distinguishes the two cases cleanly and, in the case of link problems, checks whether toxic links appeared in waves, whether they come from your own earlier measures or from outside, and whether a disavow is indicated at all. How such risks can be assessed is explained in our article Recognizing and correctly assessing link risks.
Visibility loss after a relaunch
For online shops, the relaunch is the riskiest phase. The market is large: according to the Federal Statistical Office, 85% of 16- to 74-year-old internet users in Germany shopped online in 2025, putting Germany in 6th place in the EU comparison. In the statistical report on ICT use in private households 2025, 70% of 16- to 74-year-olds stated that they had shopped online in the last three months. Every day on which category pages drop out of the index therefore costs revenue directly.
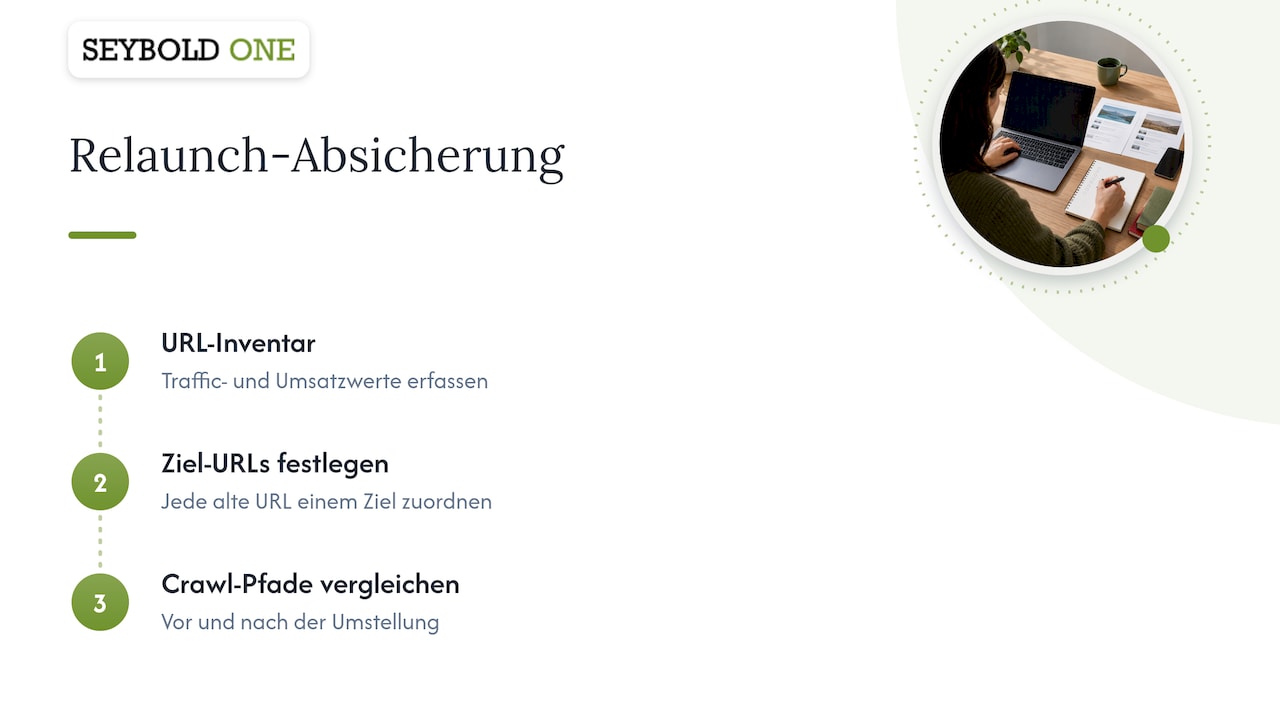
The most common causes are missing or faulty 301 redirects, lost internal linking, non-migrated metadata, and templates whose content is only loaded via JavaScript. A relaunch is secured in a data-driven way by creating a complete URL inventory with traffic and revenue values before go-live, assigning every old URL a target, and comparing the crawl path before and after the switch. For shops specifically, we go deeper in the article on e-commerce SEO for more shop visibility.
Which metrics belong in steering
Not every measurable quantity is suitable for steering. A distinction into three levels has proven useful, each answering different questions.
| Level | Typical metrics | Guiding question |
|---|---|---|
| Technical health | Share of indexed to indexable URLs, status code distribution, crawl frequency of important directories, rendering errors | Can Google find, fetch, and correctly render the relevant pages? |
| Visibility in search | Impressions and clicks per page type, CTR by position, share of generic queries | Is the website shown and clicked for business-relevant demand? |
| Business contribution | Organic conversions, revenue or leads per page type, lead quality | Does organic visibility measurably contribute to the company's success? |
Caution is advised with so-called SEO scores, which many tools show on a scale from 0 to 100. They summarize the respective vendor's check rules and are useful for a first orientation, but they say nothing about how Google actually evaluates a page. A score of 95 can sit next to an indexing problem that makes an entire directory invisible.
More meaningful is a look through Google's own tools. The SEO Starter Guide from Google Search Central emphasizes that Google should see the page like a user and needs access to CSS and JavaScript files for that; for checking, Google recommends the URL Inspection tool in Search Console. A data-driven audit therefore begins with the rendered version of important templates from Googlebot's point of view and not with a score. You will find further basics in our article on technical SEO for long-term success.
Typical misinterpretations of SEO data
Data does not protect against false conclusions; it only makes them more precise. We observe four mistakes particularly often:
- Reading correlation as cause. If rankings rise after new texts are published, a core update, a seasonal effect, or a competitor who pulled their pages can just as well be responsible. Without a control group, such as comparable unchanged pages, the connection remains a guess.
- Overrating average position. The average position in Search Console is a weighted mean across many queries. If new queries at lower positions are added, the value falls even though the website has actually gained reach.
- Measurement periods that are too short. Anyone who judges a week after a measure often measures noise. Weekday effects, holidays, and seasonality call for comparisons with the same period of the previous year.
- Equating tool visibility with real traffic. Visibility indexes are based on keyword samples. They are suitable for competitor comparisons but do not replace your own click data.
Another, strategic mistake is the hope for shortcuts. Google explicitly describes that its systems are continuously developed to detect manipulative practices. What looks like success in the data in the short term, such as a quick rise through bought links, becomes a legacy burden that later has to be worked up forensically.
Our perspective: data is the beginning of the diagnosis, not its result
In more than 25 years of visibility management, we have repeatedly made one observation: companies that come to us with a sudden ranking loss rarely suffer from a lack of data. They have tool access, dashboards, and monthly reports. What is missing is the forensic classification, meaning the ability to work out of many signals the one that actually explains the loss.
That is why we understand data-driven SEO as a combination of technical analysis, content strategy, and brand perspective. A decline in Search Console is a symptom; whether a rendering problem, lost internal linking, a toxic link profile, or a changed search intent is behind it is only decided by matching several data sources. We systematize this matching with our own AI infrastructure and with standards we helped develop, among them DIN SPEC 33461. The goal is always the same: provable causes instead of guesses and measures whose effect can be measured.
In addition, visibility today no longer arises only in classic search results. AI-powered answer systems draw on the same foundations: technically accessible, clearly structured, and trustworthy content. Anyone who already steers their SEO in a data-driven way has the best starting position to be found there as well.
How we implement data-driven SEO for your company
Whether you want to clarify a concrete cause or steer your visibility on an ongoing basis, we offer both as clearly defined services. Audits are suitable for getting started: a technical audit for €1,500 to €3,500, a forensic audit for ranking losses or suspected penalties for €1,500 to €5,500, or a complete visibility audit from €3,000, each one-time. Before a relaunch, relaunch safeguarding from €1,500 one-time protects your grown rankings. For ongoing steering there is sparring from €800 per month as well as the packages VISIBILITY CORE from €1,500, VISIBILITY GROWTH from €2,500, and VISIBILITY DOMINANCE from €6,000 per month. You will find all services and prices at a glance on our page How much does SEO cost?
Frequently asked questions about data-driven SEO
What is data-driven SEO?
Data-driven SEO is an approach in which every optimization is derived from a proven cause and checked against measurable goals. The basis is above all Search Console, crawl, log, and revenue data. The difference from routine SEO is that measures are prioritized, documented, and proven in their effect.
Which tools do I need for a data-driven SEO strategy?
Google Search Console is indispensable because it is the only source in which Google itself provides information on performance, indexing, and manual actions. In addition, you need a crawler, access to server logs, a web analytics system, and a tool for link profile analysis. What matters is less the number of tools than the ability to bring their data together and interpret it correctly.
Can I implement data-driven SEO myself?
The basics, meaning baseline, segmentation, and regular evaluation of Search Console, can be built internally. For sudden ranking losses, suspected penalties, or an upcoming relaunch, however, an external forensic analysis is usually faster and safer, because misdiagnoses in these situations cost revenue directly. Many companies therefore combine an internal team with sparring from specialists.
What is a good SEO score?
There is no universally good SEO score, because every tool vendor condenses its own check rules into a number. A high value does not rule out serious problems such as blocked resources or non-indexed directories. More meaningful are the indexing rate, click and impression development per page type, and the organic contribution to conversions.
How long does it take for data-driven SEO to show measurable results?
Technical corrections such as fixed redirect errors or released resources often show up in crawl and indexing data within a few weeks. Content and strategic measures usually need several months until they are reflected in rankings and revenue. The evaluation only becomes reliable in comparison with the previously documented baseline and the same period of the previous year.
Sources
- Google: Our approach to Search
- Google: Fighting spam – How Google Search works
- Search Console Help: Reports overview
- Google Search Central Blog: Bulk data export from Search Console
- Google Search Central: SEO Starter Guide
- Federal Statistical Office: Online shopping widespread 2025 (German)
- Federal Statistical Office: Statistical report on ICT use in private households 2025 (German)
Recommendations