Interpreting SEO Reports: Understanding Key Metrics
You interpret an SEO report correctly when you don't evaluate individual numbers but relationships: clicks, impressions, click-through rate, and average position only give a picture together, and this picture is only meaningful if you choose the fitting comparison period, separate branded from non-branded queries, and break the data down by pages, queries, countries, and devices. This guide shows how to read the central metrics from Google Search Console and your reporting, which patterns point to technical problems, content weaknesses, algorithm updates, or a manual action, and how to derive concrete, verifiable measures from the report.
Putting SEO numbers into context
SEYBOLD ONE combines technical SEO, brand strategies, and visible content to improve your search engine and AI visibility in a data-driven way.
Get a free consultationWhat an SEO report shows and what it leaves open
An SEO report condenses the performance of a website in organic search into a few metrics. The most important data source is in most cases the performance report of Google Search Console, because it comes directly from Google. According to the Search Console Help on the performance report, it shows changes in search traffic over time, the queries through which users find the website, as well as clicks, impressions, click-through rate, and average position, which can be analyzed by dimensions such as page, country, device, and period.
In a complete report, this view is supplemented by data from web analytics (sessions, engagement, conversions), by keyword rankings from rank tracking, and by technical metrics on indexing and crawling. What a report alone does not provide is the explanation: it shows that something has changed but not why. Interpretation is therefore the actual added value, and it follows a clear logic that we build up step by step in the following sections. You will find the basics of the structure and functions of the tool in our article on Google Search Console.
The four core metrics of Search Console
Before you evaluate changes, the definitions should be clear, because many misinterpretations arise simply from a wrong understanding of the measured values.
| Metric | What it measures | Typical misinterpretation |
|---|---|---|
| Clicks | Clicks from Google search results to your website | Equated with sessions in web analytics |
| Impressions | How often a link to your website was displayed in the search results | Counted as actual perception by users |
| Click-through rate (CTR) | Ratio of clicks to impressions | Evaluated without a look at position and query |
| Average position | Mean of the highest position of your website in the results in each case | Read as the exact ranking of a keyword |
Clicks and impressions
Clicks are the hardest metric in the report because they reflect actual visits from search. Impressions, by contrast, show reach: if they rise, your website is displayed for more or more frequently searched queries. What matters is the relationship between the two values over time. Rising impressions with stagnating clicks often indicate that you are becoming visible for additional queries but still stand in lower positions there.
Click-through rate
According to Google, the CTR is the ratio of clicks to impressions. It depends strongly on the position, the type of query, and the presentation in the search result; a branded query naturally has a completely different click-through rate than a general informational term. You should therefore always evaluate the CTR per query or page group, never as an average across the entire website. How to design titles and snippets so that they are clicked more often is shown by our checklist for better-clicked content.
Average position
Average position is the most frequently misunderstood metric. It is not a ranking but a mean across all impressions, and it is calculated differently depending on the view: the Search Console Help on performance data explains that when aggregating by property, the highest position across the entire property counts, whereas when aggregating by page, the highest position of the respective page counts. Click-through rate and average position therefore turn out differently in the two views. A value of 8.4 can thus mean that a page consistently stands at position 8, or that it appears at position 2 for some users and at position 20 for others. For reliable statements on individual terms, it is worth looking at the keyword ranking of individual queries.
Knowing the limits of the data
Anyone who interprets Search Console must know what it does not fully reflect. The Google Help on troubleshooting the performance report names several limitations that play a role in almost every analysis:
- Row limit: The table in the report contains a maximum of 1,000 rows. For large websites or shops, many long-tail queries and URLs are therefore missing in the interface.
- Anonymized queries: Rarely entered queries are omitted from the table for privacy reasons. The sum of clicks in the table is therefore often smaller than the total value in the chart.
- Delay: Data is generally only available after two to three days. An apparent drop in the last few days is often just an incomplete data situation.
- Time zone: Daily data is kept in Pacific time, except in the 24-hour view. In comparisons with web analytics, which usually runs in Central European time, shifts occur at the day boundaries.
For deeper analyses, for example with large shops or periods beyond 16 months, Google Search Central names the Search Analytics API and the bulk export as options. We recommend this route at the latest when decisions about budgets or a relaunch are based on the data.
Choosing the right comparison period
A metric without a comparison is worthless. The central question when interpreting is always: compared with what?
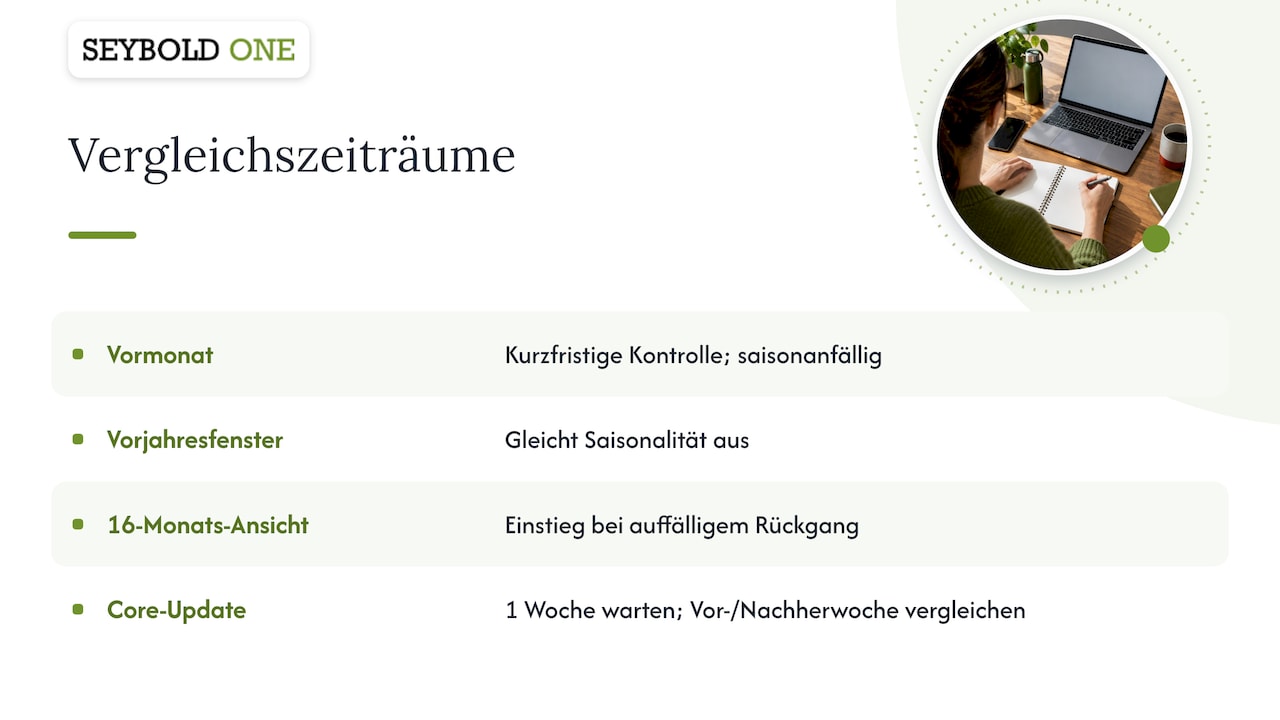
The previous month is suitable for short-term control but is prone to seasonal effects. An online shop for garden furniture will almost always have fewer clicks in October than in May without anything having changed in its SEO performance.
The prior-year window evens out seasonality. Adam Tanguay recommends comparisons over longer periods on Search Engine Land, meaning quarter to quarter or year to year, in order to separate seasonal effects from real SEO changes.
The 16-month view is the recommended starting point for every conspicuous decline. Google advises extending the period in the performance report to the full 16 months in order to distinguish recurring patterns from real losses.
The weeks around a core update follow their own rule. If a drop coincides in time with a core update, Google recommends in its documentation on core updates waiting at least a full week after the rollout has finished and then comparing the week after with a week before the update began. Google also classifies the magnitude there: a drop from position 2 to 4 does not require radical changes, whereas a fall from position 4 to 29 calls for a deeper review.
Separating branded and non-branded traffic
One of the most effective segmentations in SEO reporting is the separation by branded and non-branded queries. Tanguay recommends on Search Engine Land splitting organic traffic consistently into these two groups in order to isolate real SEO success from general marketing effects.
The reason is simple: queries with your company or product name rise when campaigns, trade fairs, press coverage, or TV advertising are running, and they fall when these end. A report that mixes both attributes successes to SEO that come from marketing, or conversely hides real losses in generic search terms. In Search Console you set one filter for queries that contain your brand name including common spelling variants, and a second one that excludes exactly these. Why brand terms play a role of their own is explained in our article on the branded keyword.
If the non-branded segment grows, that is a strong signal that your content is being found by new target groups.
Recognizing patterns: what a change means
The actual interpretation consists of assigning patterns in the metrics to a probable cause. The following overview is based on the recommendations of Google on analyzing traffic drops:
| Pattern in the report | Possible cause | Next check |
|---|---|---|
| Impressions stable, clicks fall | Less convincing titles or snippets, more attractive results from other websites | Check the search results manually, revise snippets |
| Impressions and clicks fall website-wide | Technical problem or algorithmic reassessment | Page indexing report, crawl stats |
| Decline only for a few important URLs | Page-specific problem | URL Inspection: crawlability, indexability, canonical URL |
| Decline coinciding with a core update | Reassessment of content | Weekly comparison before and after the rollout |
| Drop for certain queries | Demand is changing | Compare search interest in Google Trends |
| Sudden, severe loss without a recognizable reason | Possible manual action | Open the “Manual actions” report |
| Decline only on mobile devices or in one country | Display or delivery problem | Filter by device and country |
Narrowing down ranking losses systematically
With a sudden decline, a fixed procedure helps so that optimization doesn't happen hastily in the wrong place. The Search Console Help on traffic drops and Google Search Central describe the basics, which we apply like this in our analysis practice:
- Set the period: Open the performance report, extend the view to 16 months, and determine the exact start of the decline.
- Set up a comparison: Compare the affected period with the previous period or the prior-year window.
- Check pages: In the “Pages” tab, sort by the difference in clicks and look for the rows with the biggest losses.
- Check queries: Switch to the “Queries” tab to recognize patterns, for example whether an entire topic cluster is affected.
- Go through dimensions: Check countries, devices, and search appearance to determine whether the loss is limited to one category.
- Determine the scope: If the loss is website-wide, open the page indexing report; if it affects few URLs, use the URL Inspection tool.
- Rule out technology: Google names server availability, robots.txt, error pages (“Page not found”), and an accidentally set noindex as typical technical causes.
- Check manual actions: According to the “Manual actions” report, Google intervenes when a reviewer determines that pages violate the spam policies; affected pages may rank lower or disappear from the results entirely.
Reading data correctly after a relaunch
After a relaunch, interpretation is especially demanding because several effects overlap. In its guide to traffic drops, Google points out that rankings can fluctuate after a change to existing URLs while the pages are crawled and indexed again. A temporary decline is therefore not automatically an alarm signal, but a lasting one is.
For a clean assessment we recommend three comparison levels:
- Prior-year window: Clicks and impressions of the weeks after go-live compared with the same weeks of the previous year, to factor out seasonality.
- Page level: Compare the most important old URLs with their new target URLs. If the traffic of a formerly strong page is missing entirely, there is often a redirect or indexing problem.
- Indexing: In the page indexing report, check whether the new URLs are being picked up and whether old URLs show up with errors.
Anyone who still has the relaunch ahead should set these measuring points beforehand.
From report to measure
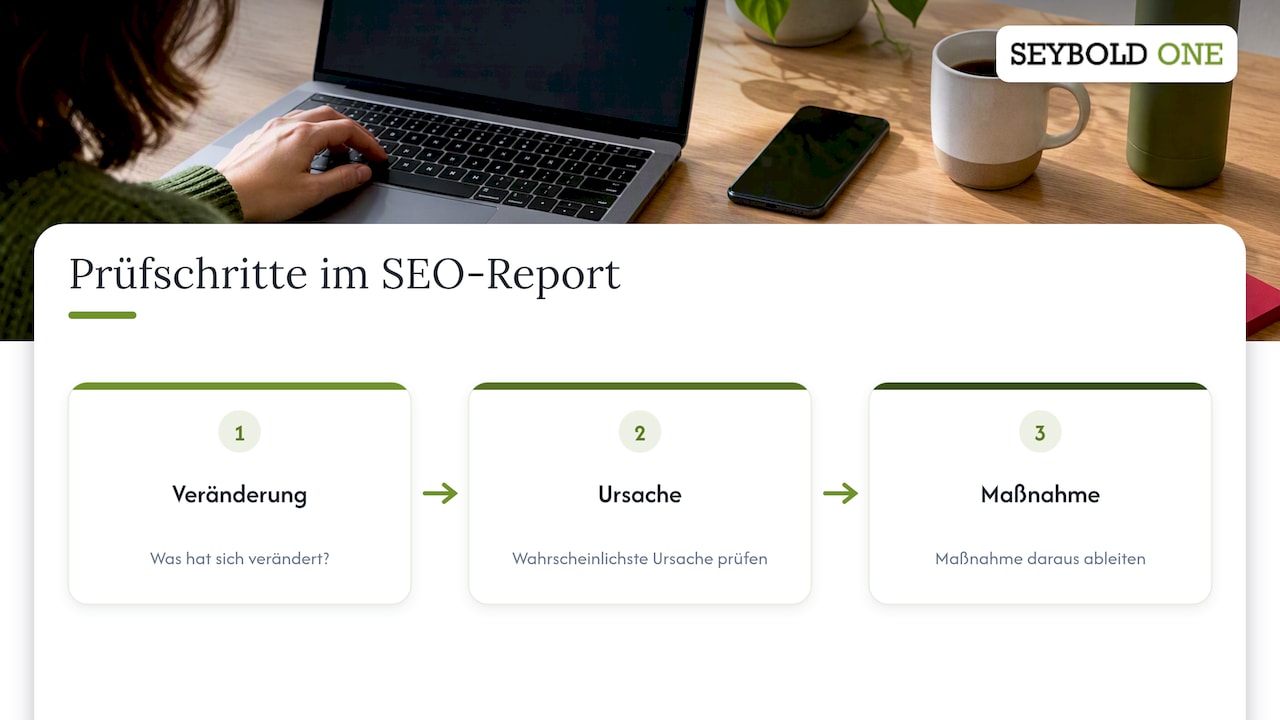
A report is only valuable once decisions follow from it. A structure that answers three questions for every finding has proven itself: what has changed, which cause is most likely, and which measure do we derive from it?
For keyword reporting this means concretely: for every target keyword, report the current position, the position of the previous period, the change, and the URL that actually ranks. The ranking URL in particular is often forgotten, even though it shows whether Google serves the desired page or another one, which can point to cannibalization or unclear internal linking.
For monitoring the effect, patience applies: Google recommends waiting a few weeks after changes and then checking the Search Console report again. So record the date of every measure in the report so that later changes can be assigned unambiguously. Without this change log, every interpretation remains a guess.
Our perspective on SEO reporting
In more than 25 years of visibility management, we have learned that most wrong decisions in SEO do not arise from missing data but from wrongly read data. A report that only shows curves tempts people into hasty action: titles are rewritten, content is deleted, or links are devalued although the cause lies somewhere else entirely.
That is why we work forensically. We separate seasonal patterns from real losses, brand effects from organic performance, and technical causes from algorithmic reassessments before we recommend a measure. We have anchored this approach in our own standards, among other things through the co-development of DIN SPEC 33461, so that visibility can be measured and assessed traceably.
Especially with sudden ranking losses, after a relaunch, or when a Google penalty is suspected, every week counts. In such situations a report should not reassure but deliver a reliable diagnosis from which prioritized steps follow.
When the report raises more questions than it answers
If a decline cannot be assigned unambiguously with the steps described, or if revenue and leads depend directly on visibility, an external analysis is worthwhile. Our forensic audit costs €1,500 to €5,500 one-time and systematically narrows down the causes of ranking losses and penalties; the full visibility audit is available from €3,000, relaunch safeguarding from €1,500. Anyone who wants to classify their reports on an ongoing basis together with specialists can begin with our sparring from €800 per month.
You will find all services and prices on our page How much does SEO cost?
Frequently asked questions about SEO reporting
How often should I evaluate an SEO report?
For most companies a monthly report with a prior-year comparison makes sense, supplemented by a weekly quick check of clicks in Search Console. After a relaunch, a core update, or a conspicuous drop, you should watch the data more closely, meaning weekly. It is important to factor in the delay of two to three days in Search Console data.
Why do Search Console and web analytics not match?
Both systems measure different things: Search Console counts clicks in the search results, while web analytics counts sessions on your website, which additionally depend on consent, tracking setup, and time zone. Deviations are therefore normal. What matters is that the trends of both sources move in the same direction.
Which metric is the most important in SEO reporting?
There is no single most important metric, but clicks from non-branded queries are the most direct indicator of organic performance. The report only becomes economically relevant when these clicks are linked to conversions such as inquiries or orders. Positions and impressions explain why clicks change.
When does a decline point to a Google penalty?
A sudden, severe loss that can be explained neither by seasonality nor by an update or a technical problem can be a hint. Certainty only comes from the “Manual actions” report in Search Console, which shows existing actions together with the affected pages. Algorithmic reassessments do not appear there and have to be narrowed down through pattern recognition in the performance report.
Sources
- Google Search Console Help: Performance report (Google Search results), overview
- Google Search Console Help: Performance report (Search results), data
- Google Search Console Help: Performance report, troubleshooting data
- Google Search Central: Debug Google Search Traffic Drops
- Google Search Console Help: Why did my site traffic drop?
- Google Search Central: Google Search’s Core Updates
- Google Search Console Help: Manual actions report
- Search Engine Land: 4 smarter ways to measure SEO effectiveness
Recommendations